
Q2 2026 San Francisco Multifamily Report
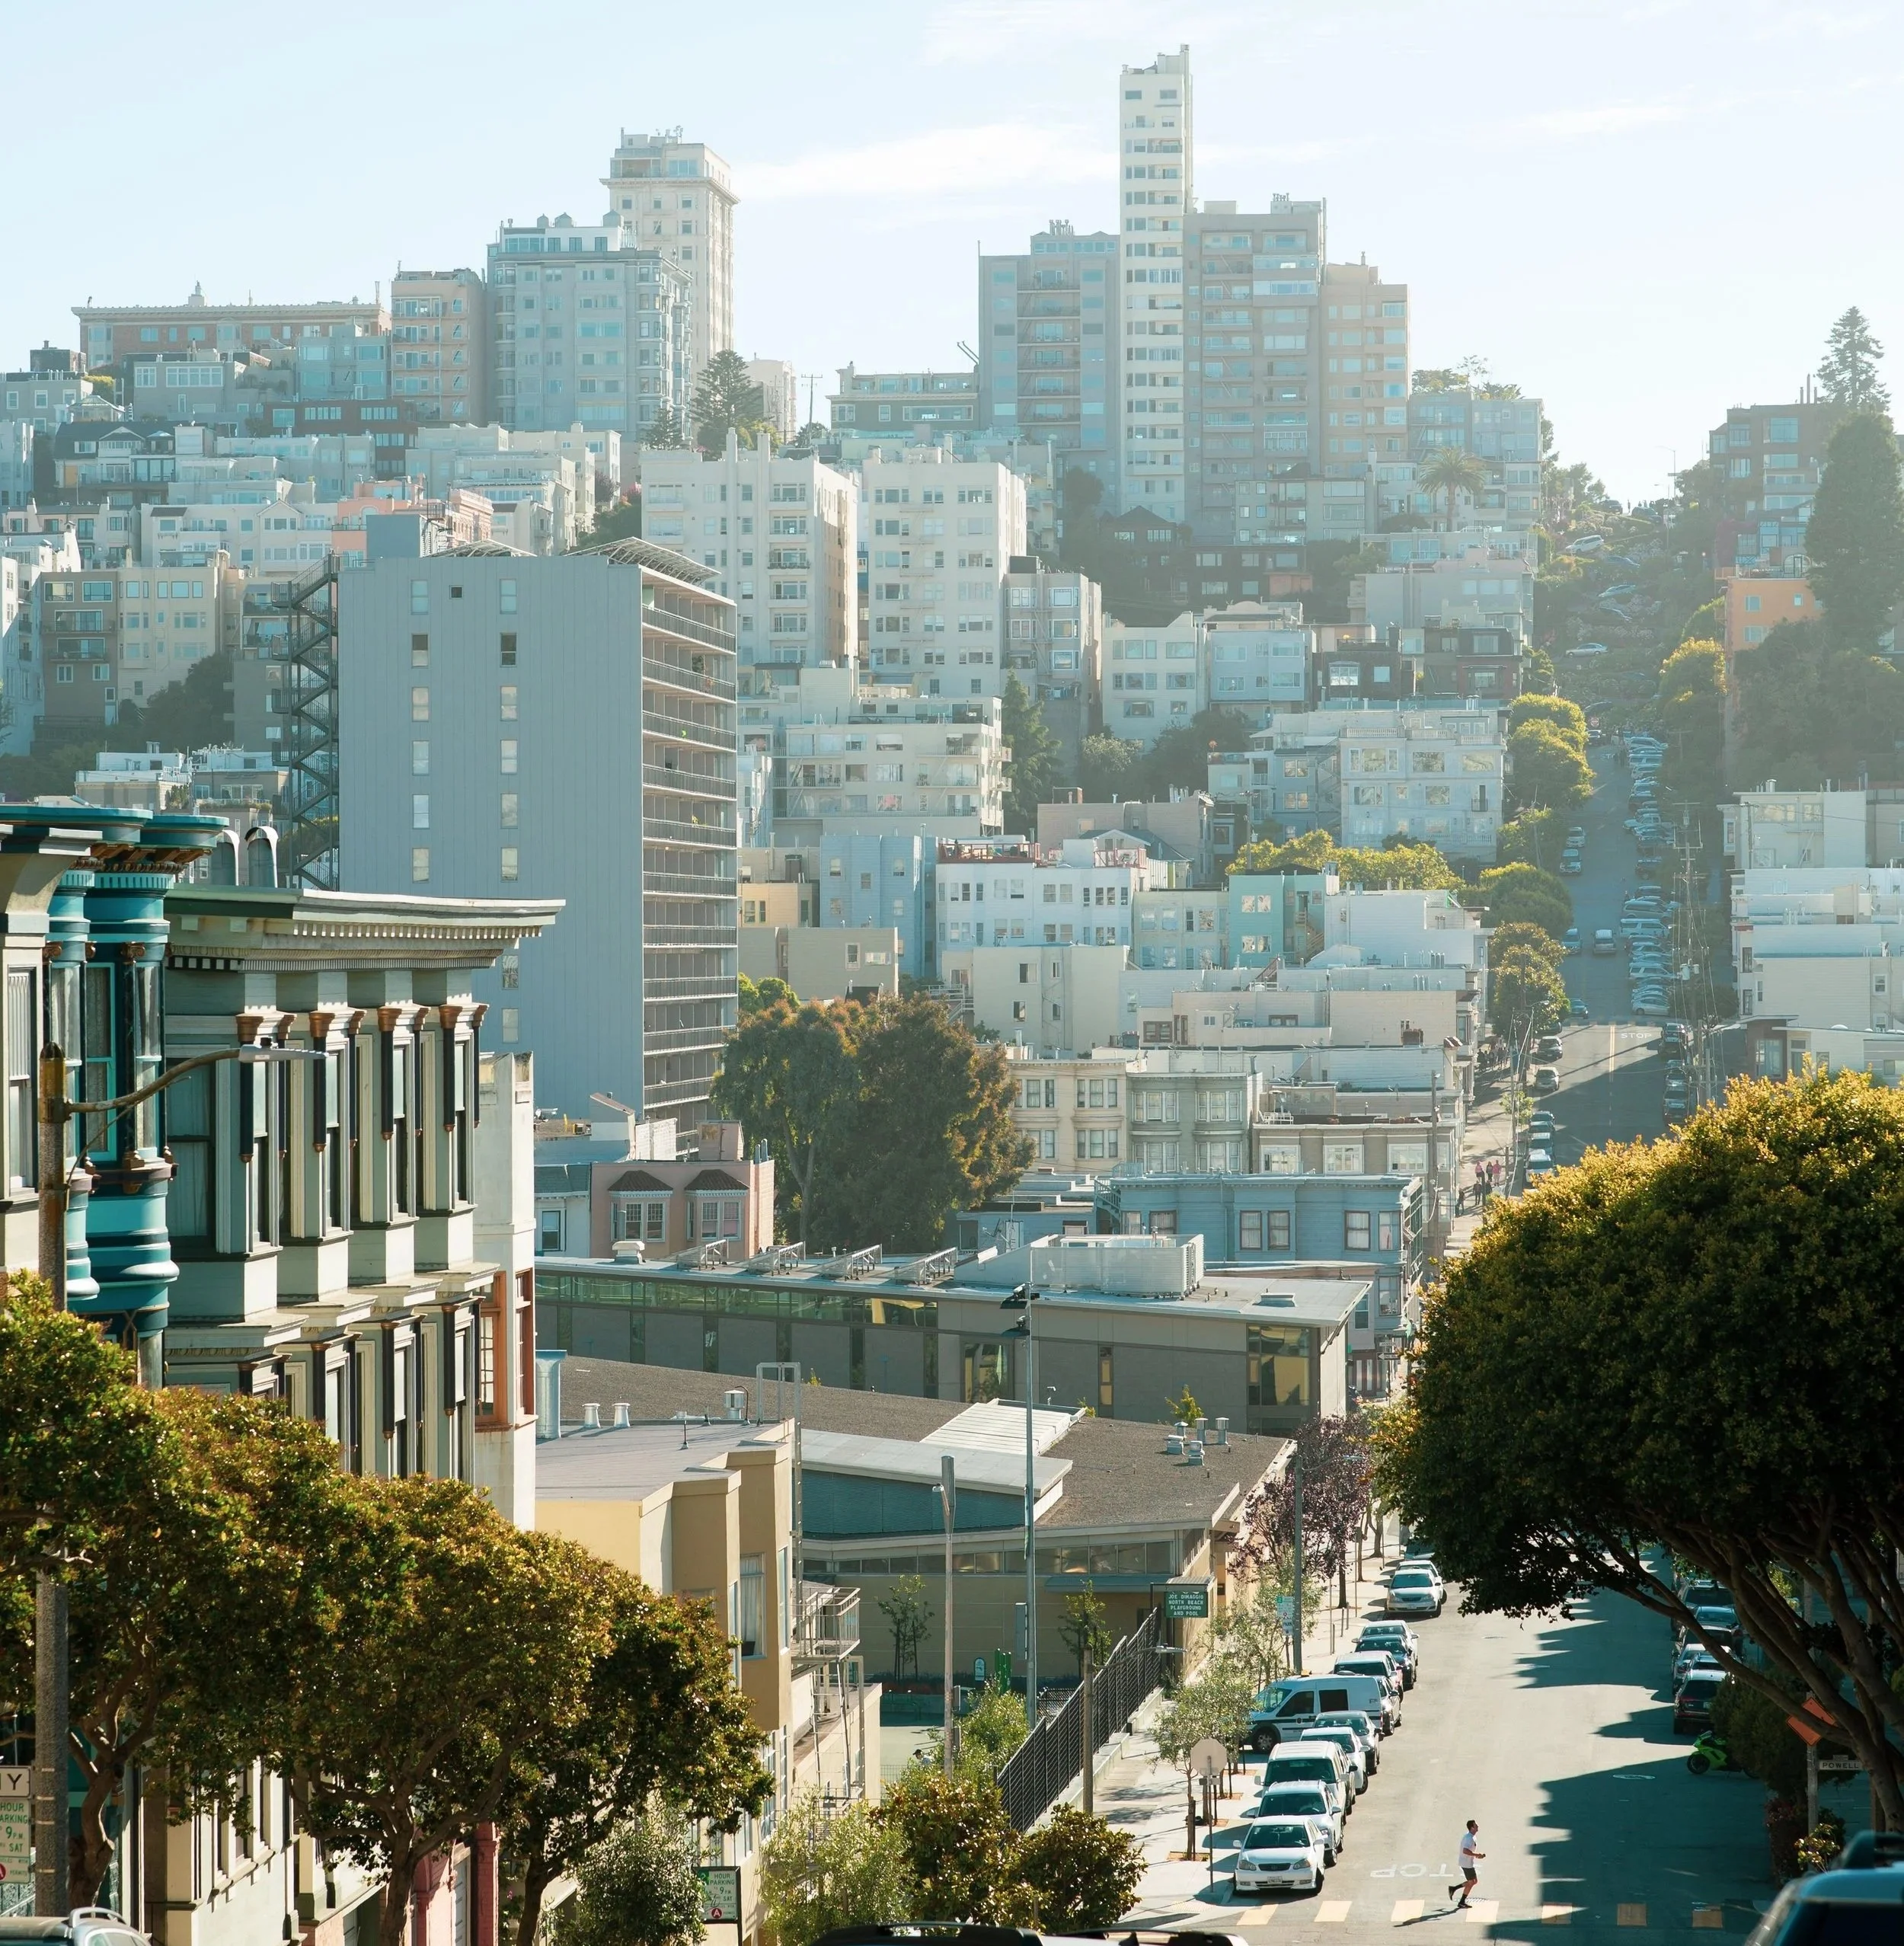
The San Francisco multifamily market continues to heat up. Well priced and quality listings continue to be absorbed quicker and quicker, and rents are being driven upward by AI related companies hiring in San Francisco.
Key market indicators reflect:
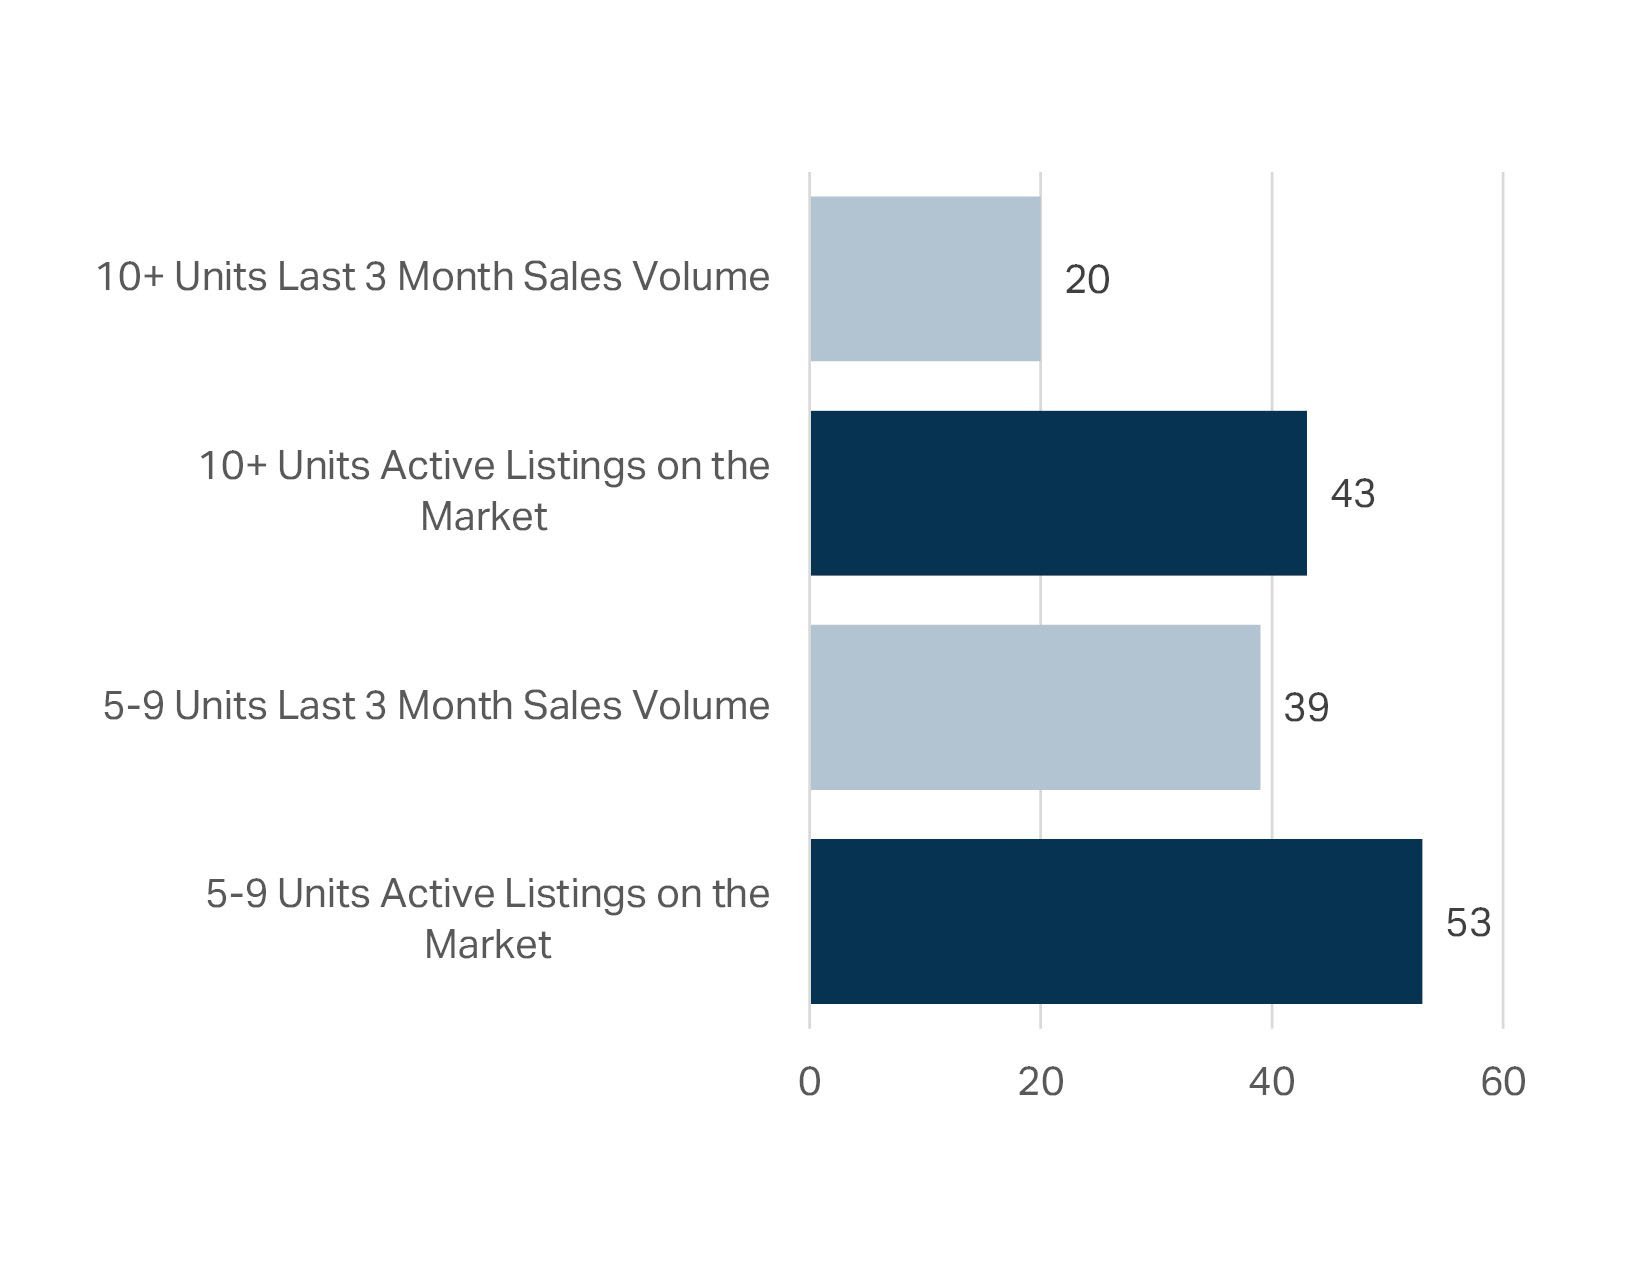
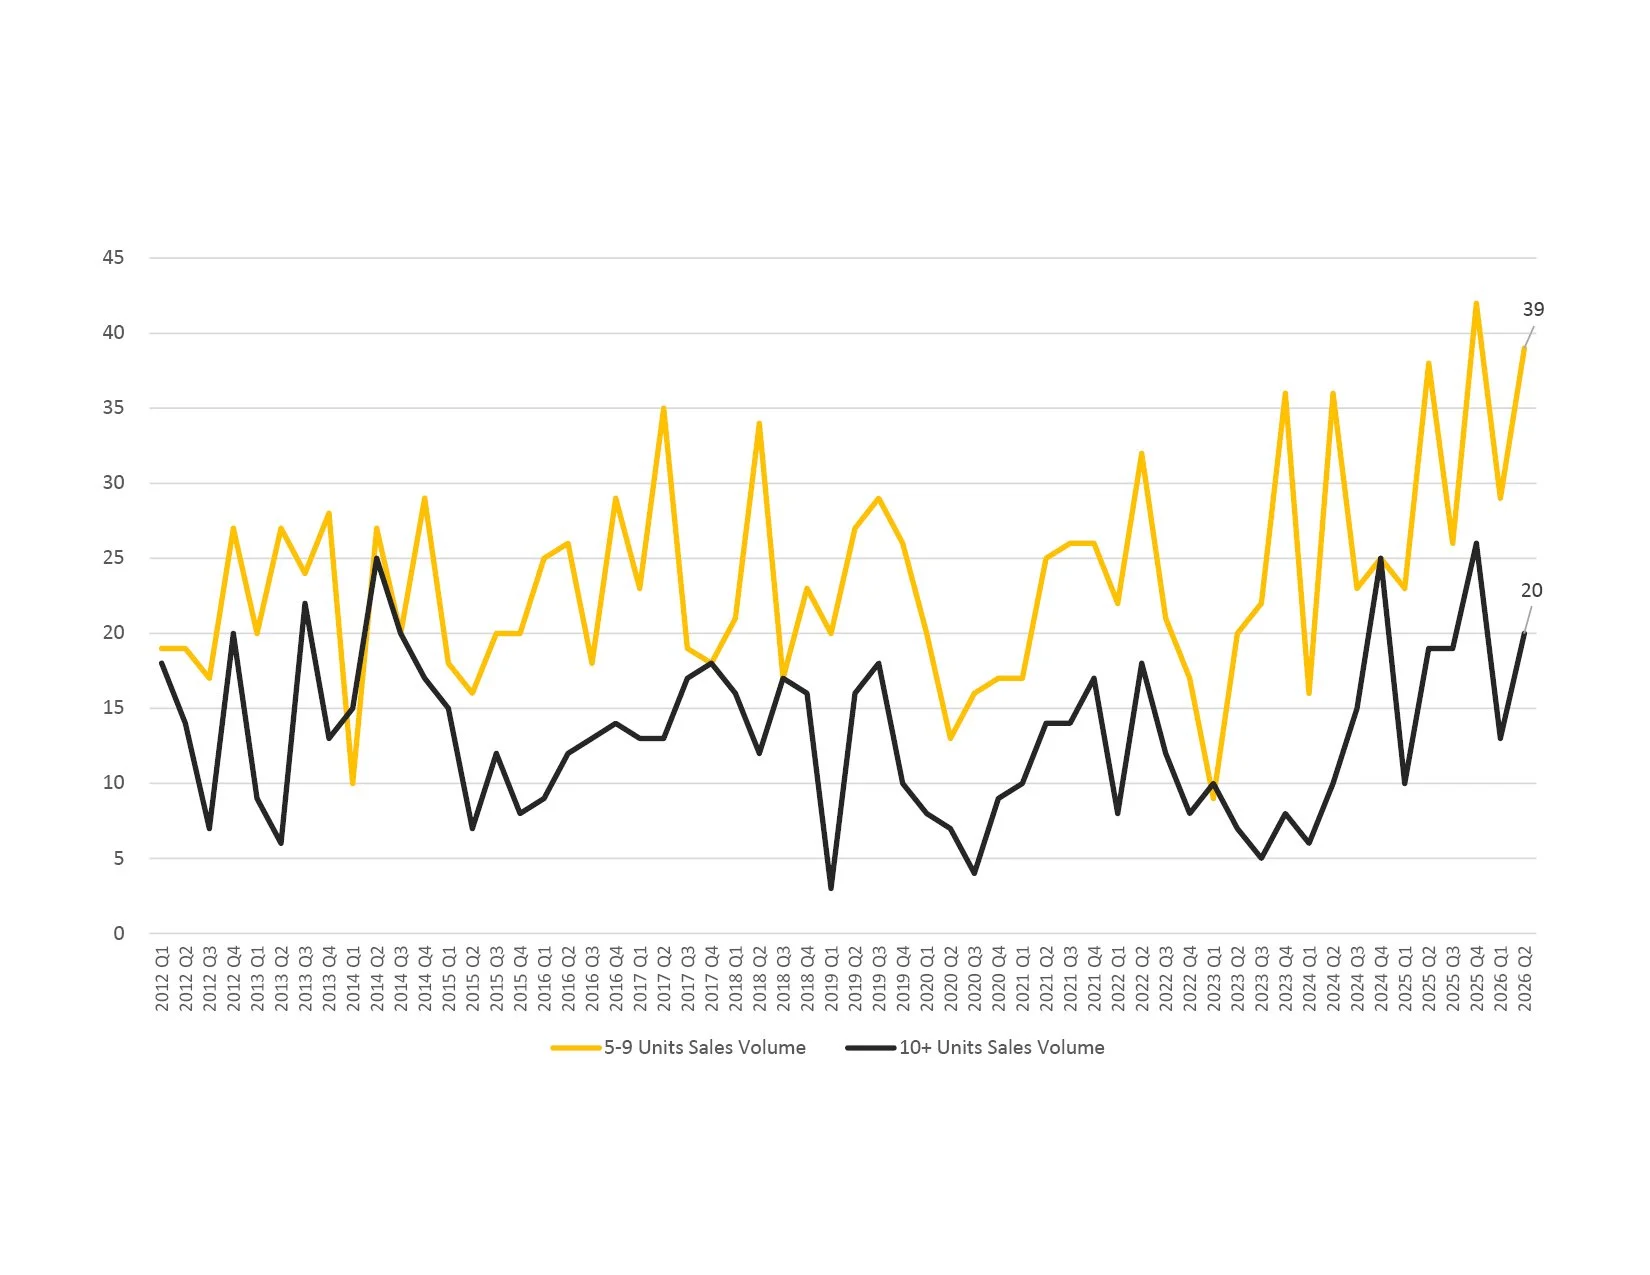
• Absorption improved in Q2 2026 versus Q1. Last three month sales absorbed 47% of current 10+ unit inventory (20 of 43 active listings), up from 42% in Q1 (13 of 31 active). For 5 to 9 unit properties, absorption rose to 74% (39 of 53 active) from 48% in Q1 (29 of 60 active).
• Sales velocity increased with 20 properties of 10+ units sold in the last three months (up from 13 in Q1 2026) and 39 properties of 5 to 9 units sold (up from 29).
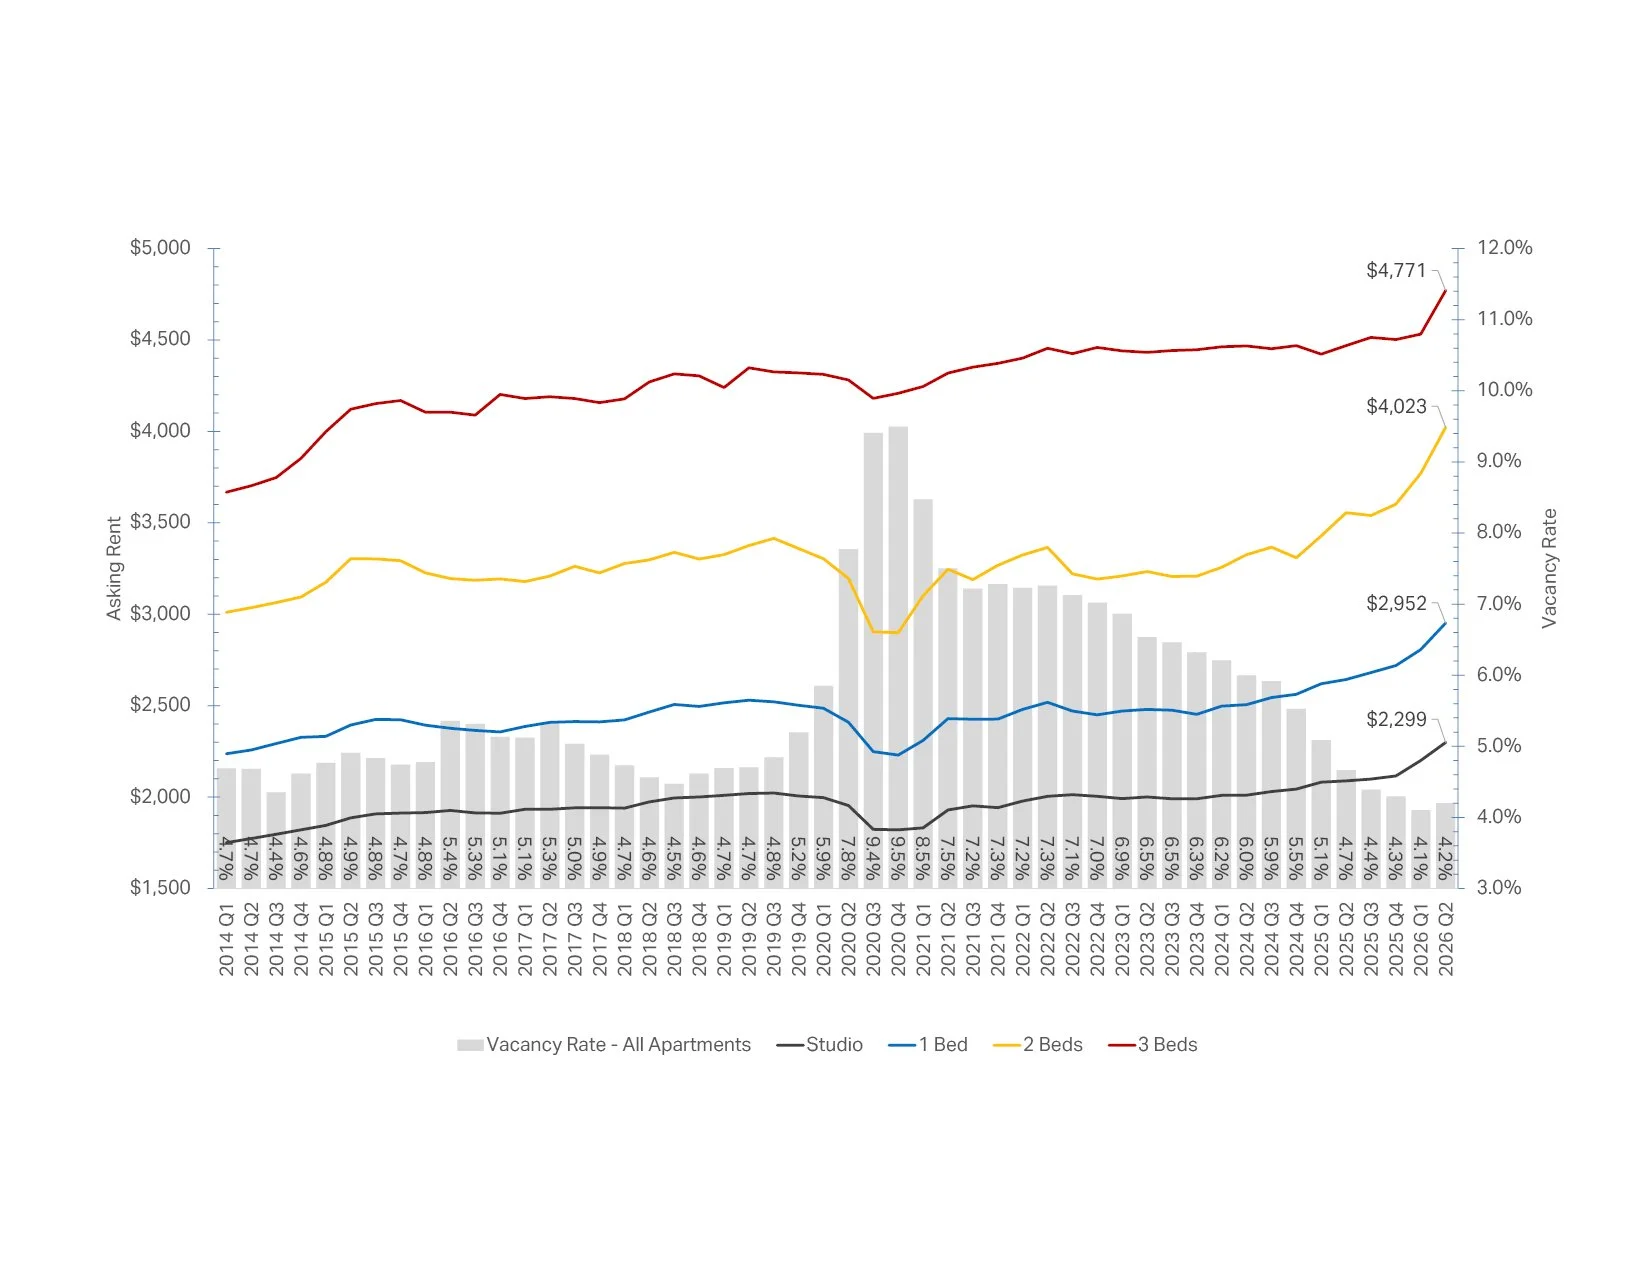
• Effective rents continued their quarter over quarter growth, with average asking rents rising approximately 5% versus Q1 and roughly 12% year over year, amid persistently low vacancy levels.
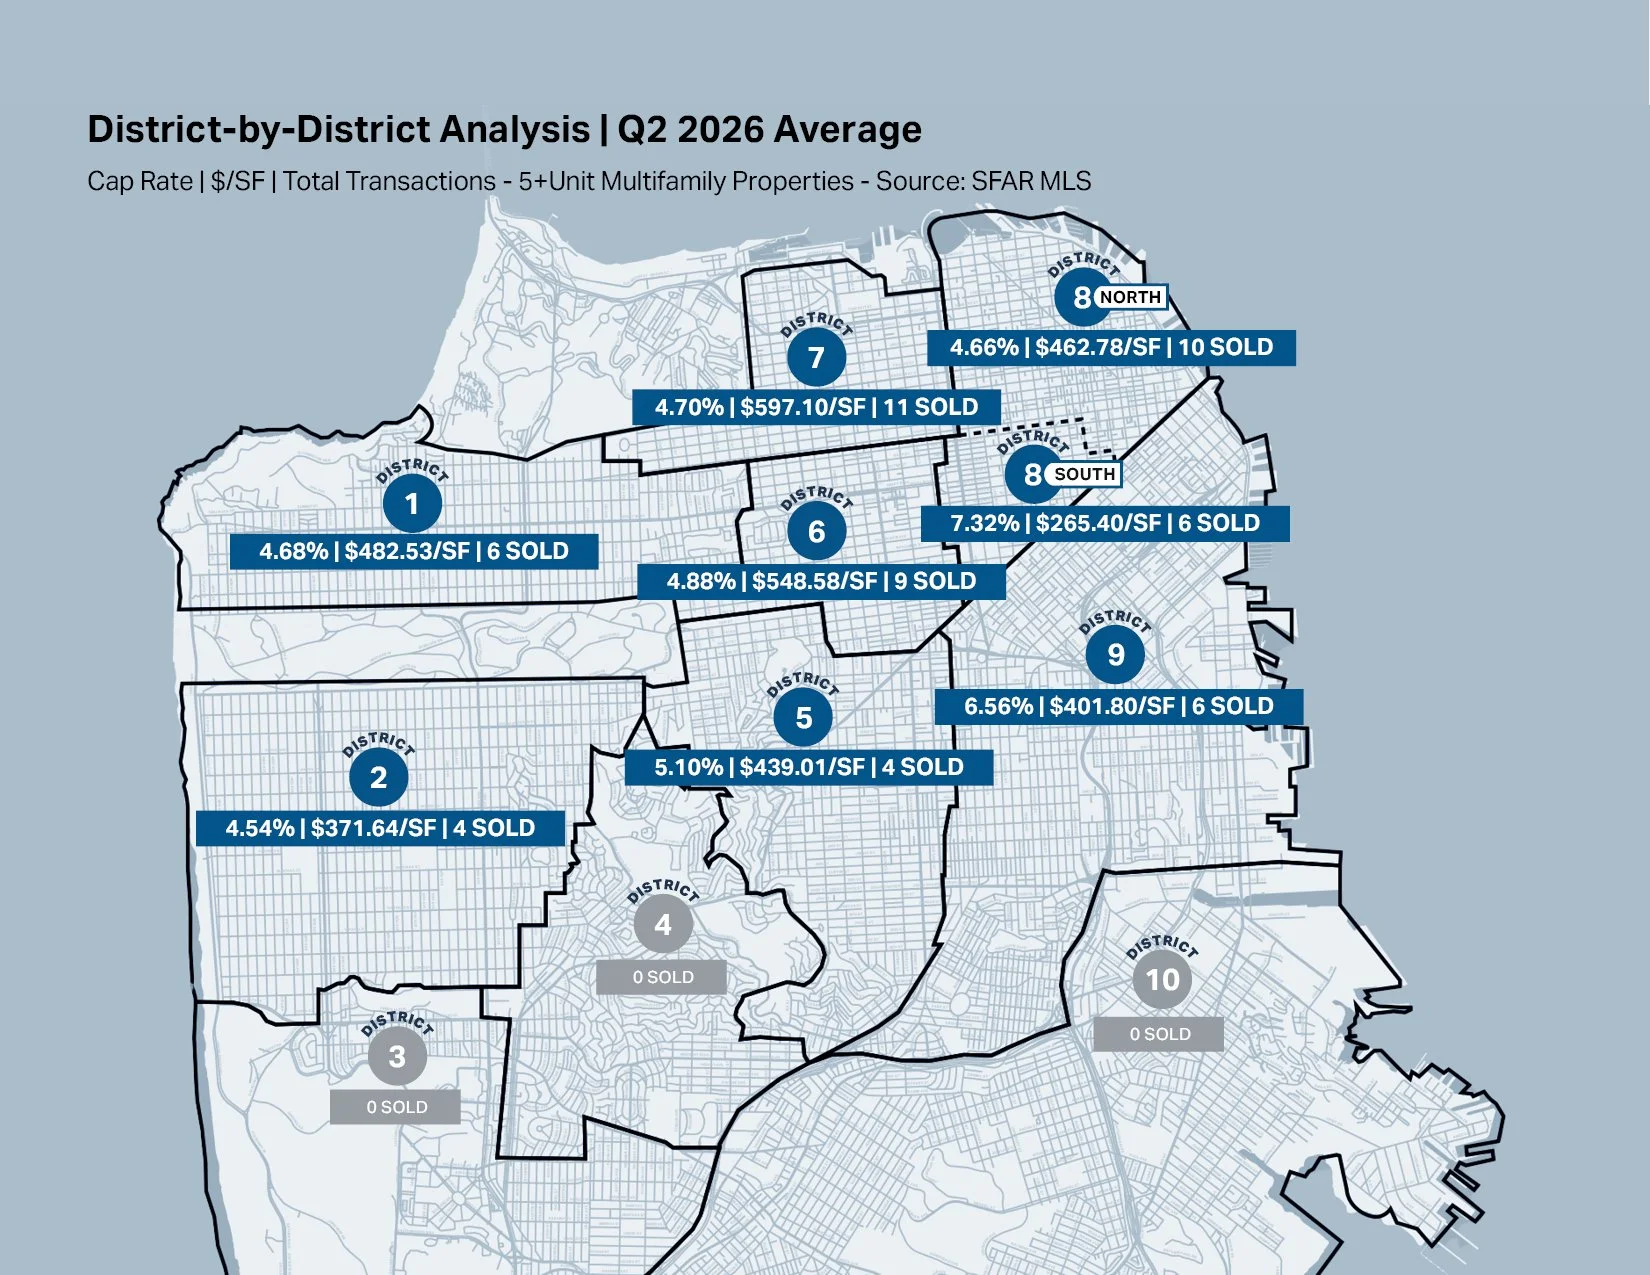
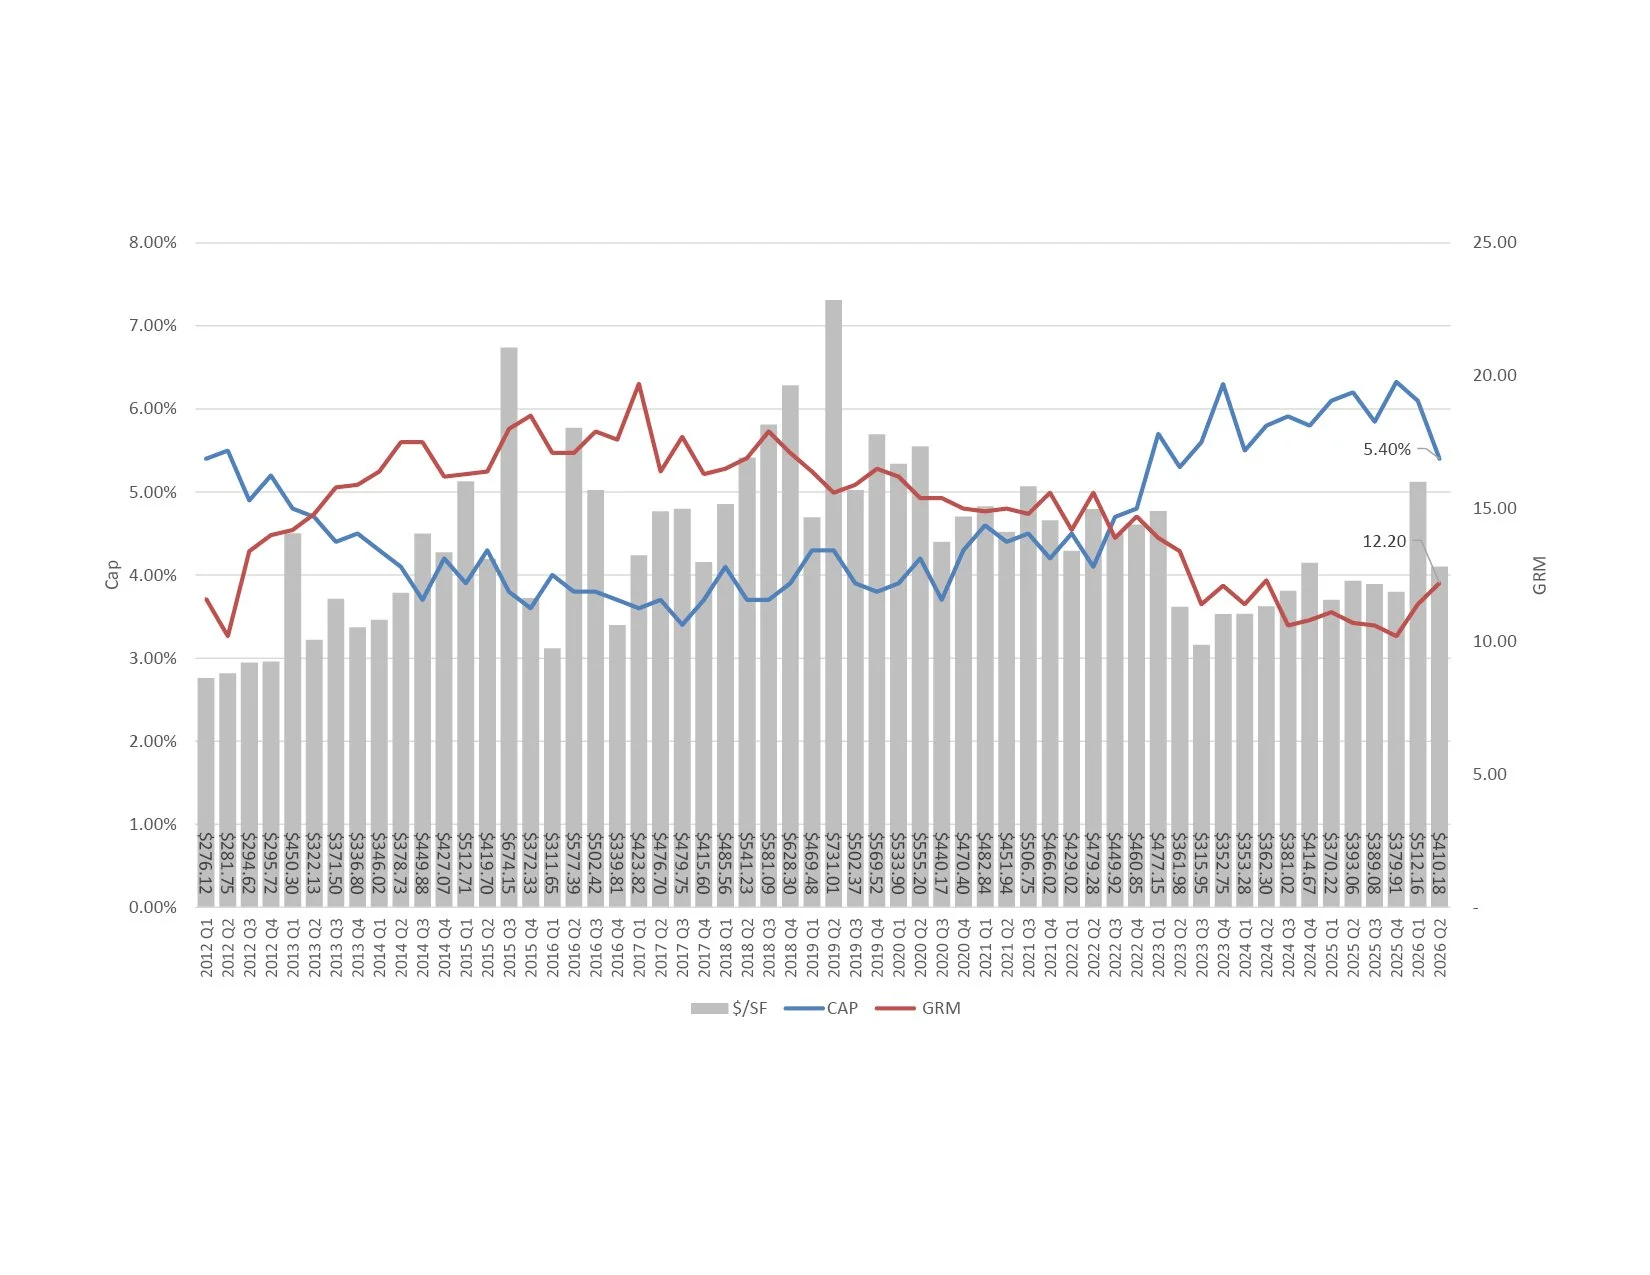
• Cap rates remained competitive with several districts averaging in the mid 4% range and $/SF values reaching $597+ in high demand areas.
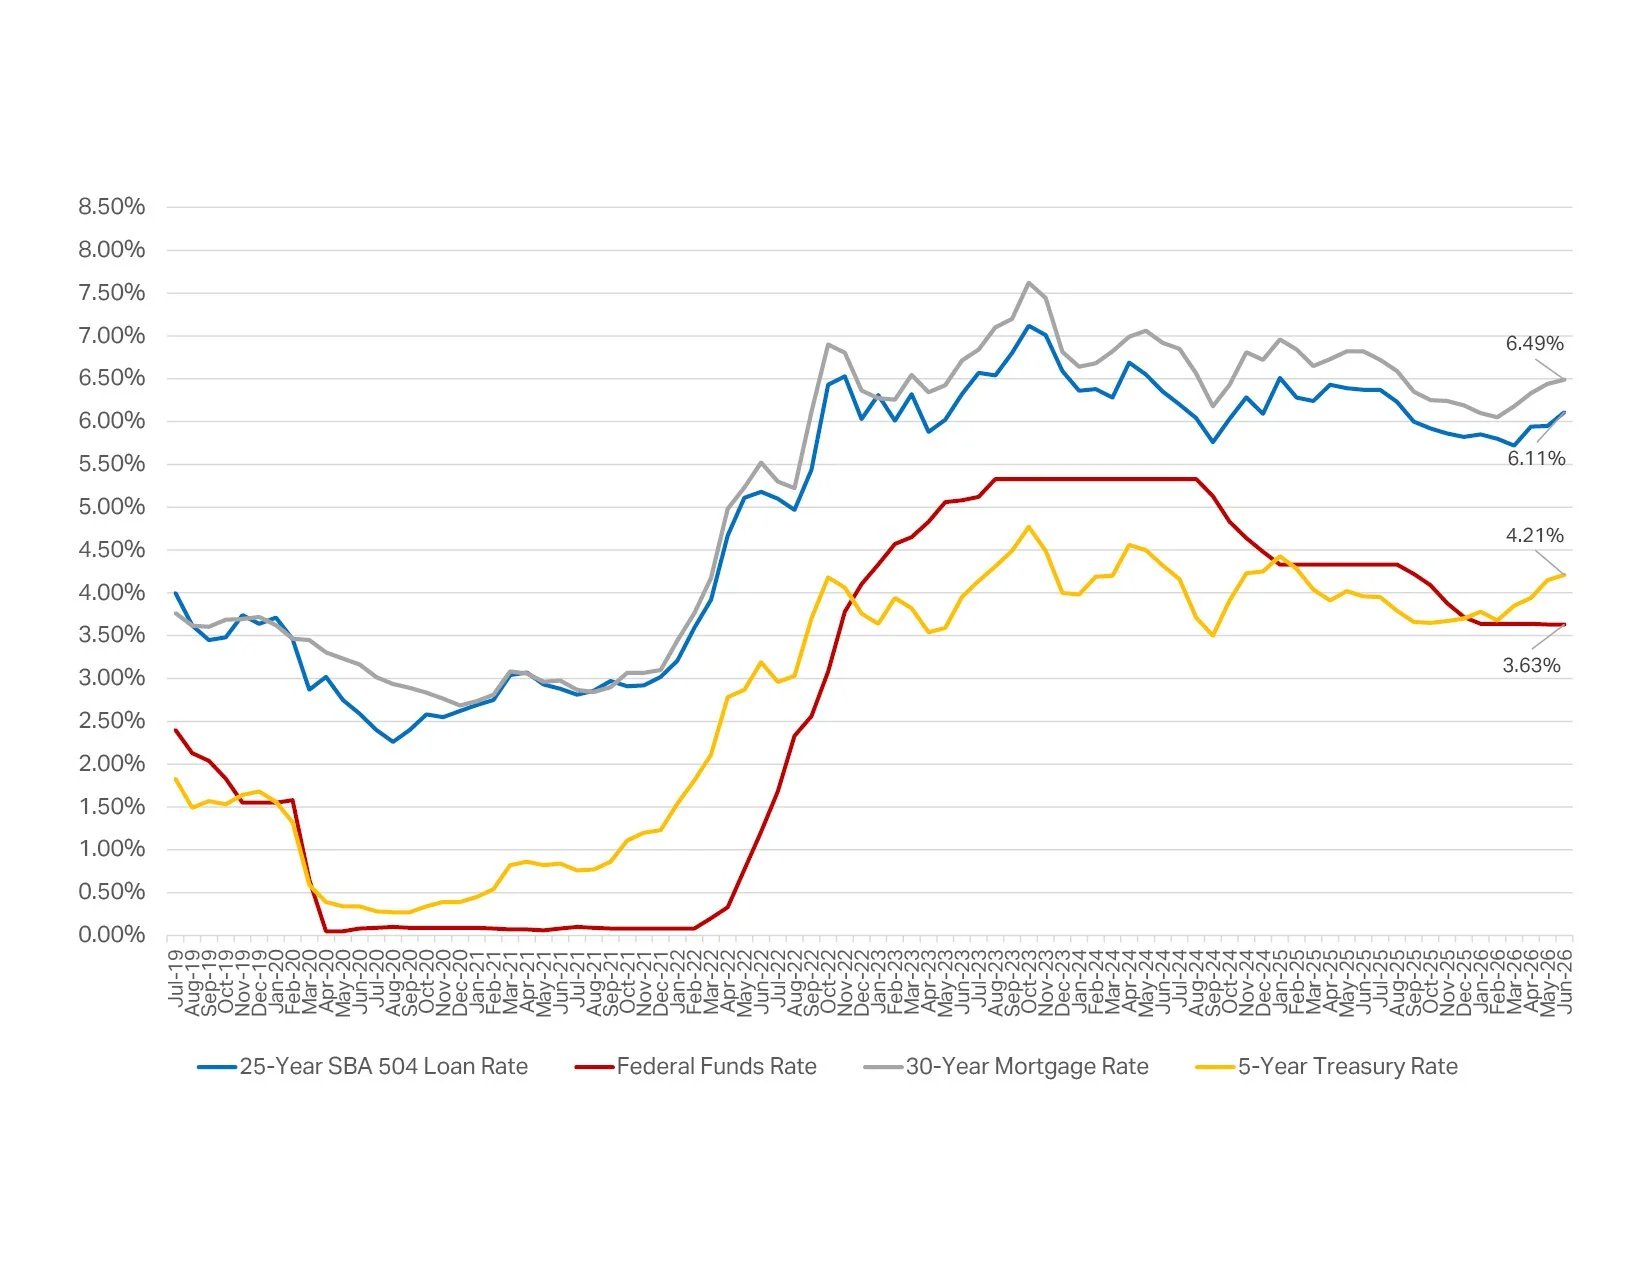
On the ground, LL CRE observed growing buyer conviction, with investors accepting tighter initial yields even as borrowing costs edged higher. The citywide average cap rate compressed to 5.40% from 6.10% in Q1, a sign that buyers are underwriting continued rent growth rather than waiting for rate relief.
Looking ahead, LL CRE maintains a positive outlook for the San Francisco multifamily sector and anticipates healthy transaction velocity through the second half of 2026. As absorption increases and cap rates compress the market is finally starting to shift back towards a Seller’s market.
District-by-District Analysis | Q2 2026 Average/Total
Cap Rate | $/SF | Total Transactions - 5+Unit Multifamily Properties - Source: SFAR MLS
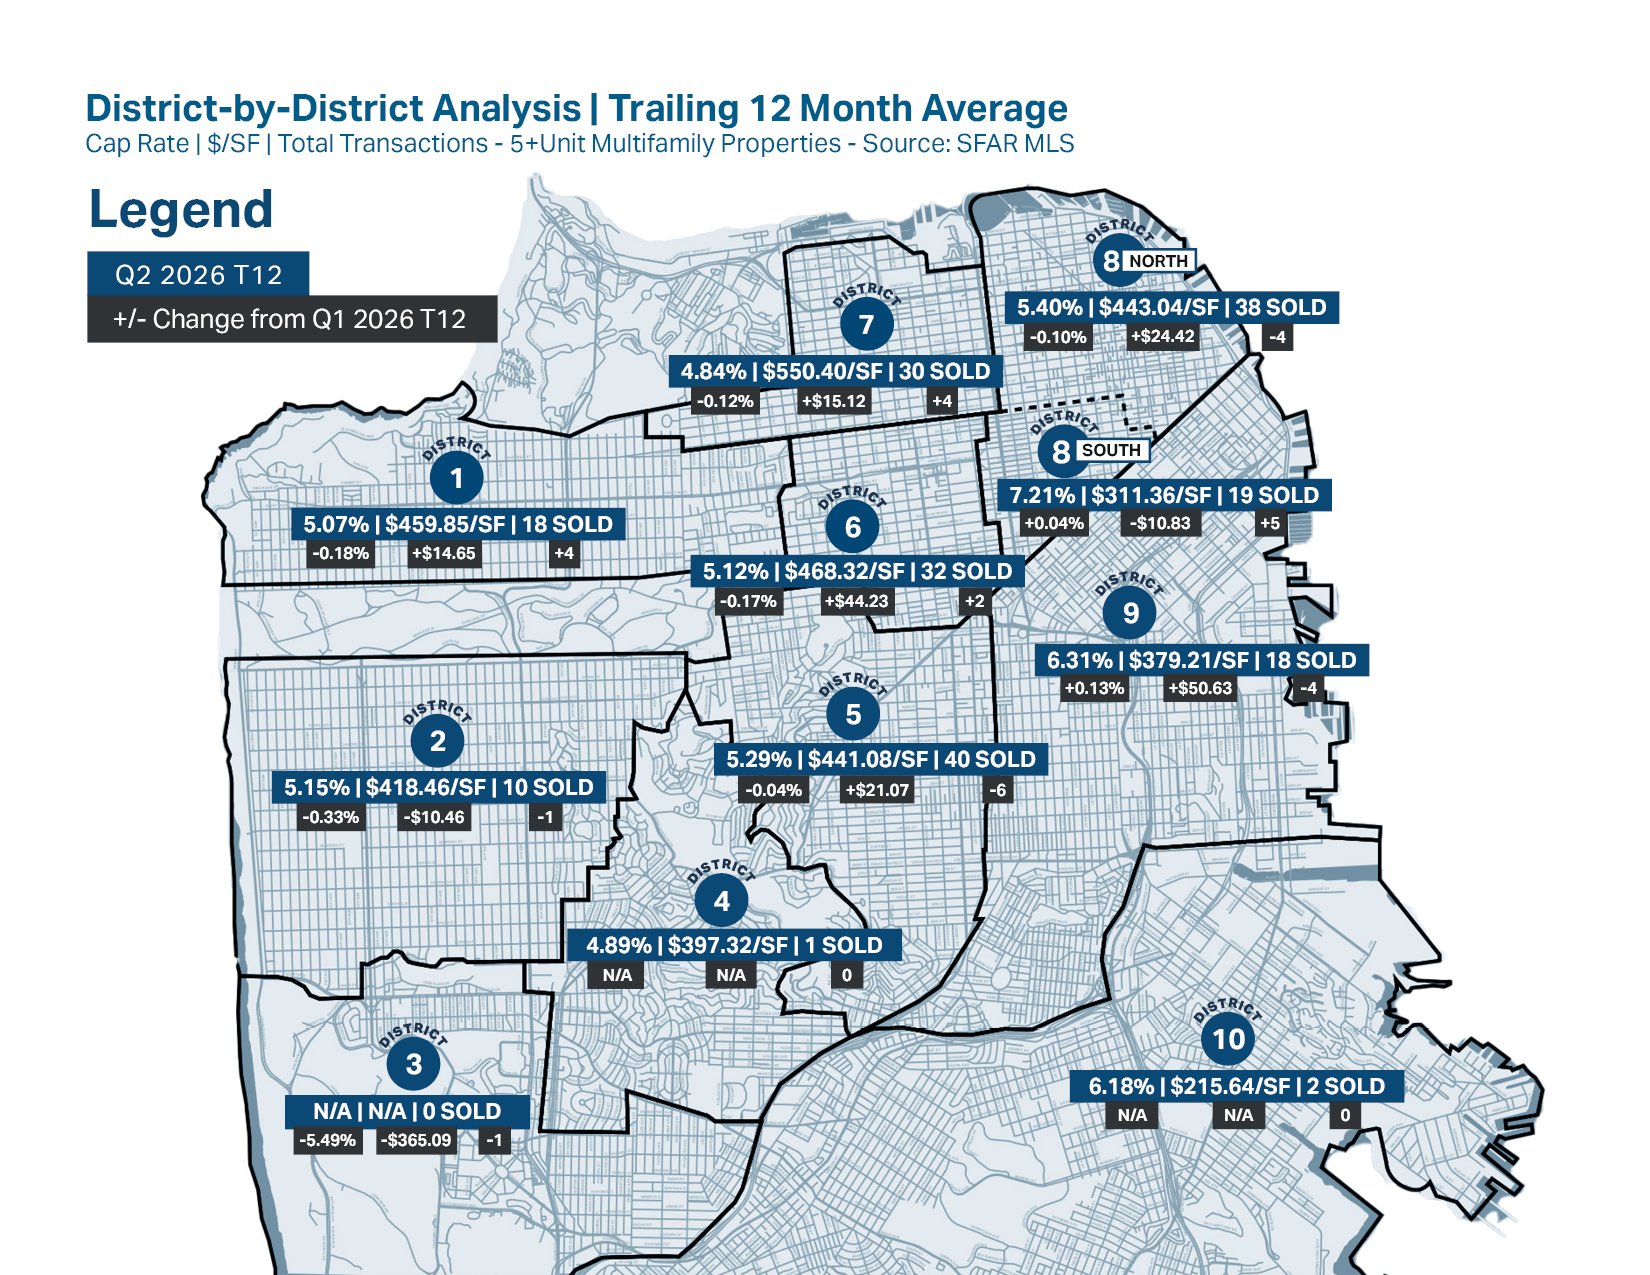
District-by-District Analysis | Trailing Twelve Month Average/Total
Cap Rate | $/SF | Total Transactions - 5+Unit Multifamily Properties - Source: SFAR MLS
Transaction Volume and Active Listings
5+ Unit Properties - Sales Volume
5+ Unit Properties - Average $/SF | Cap Rate | GRM
Multifamily Vacancy Rate & Average Asking Rents
Federal Funds Rate, 30-Year Mortgage Rate,
5-Year Treasury, and 25-Year SBA504 Loan Rate
This report has been prepared solely for information purposes. The information herein is based on or derived from information generally available to the public and/or from sources believed to be reliable. No representation or warranty can be given with respect to the accuracy or completeness of the information. Compass and LL CRE Group disclaim any and all liability relating to this report, including without limitation any express or implied representations or warranties for statements contained in, and omissions from the report. Nothing contained herein is intended to be or should be read as any regulatory, legal, tax, accounting or other advice and Compass/ LL CRE Group does not provide such advice. All opinions are subject to change without notice. Compass and LL CRE Group makes no representation regarding the accuracy of any statements regarding any references to the laws, statutes or regulations of any state are those of the author(s). Past performance is no guarantee of future results.